All code for this blog post can be found at https://github.com/bkinsey808/nx-graphql-fullstack.
Why care about bundle size?
Bundle size, especially initial bundle size, is an important metric which determines not only how fast your web app will load, but even, potentially, how well your site ranks on search engines.
Bounces are when a user hits your page but then rapidly leaves. Studies have shown that bounce rate increases dramatically with perceived slowness of your web app.
Perceived slowness can be hinted at by a number of metrics such as First Contentful Paint and Time to Interactive. However, bundle size is fundamental and often must be dealt with first, and that’s what this blog post will discuss.
Nx makes it easy to set budgets for initial bundle size. Search for ‘budgets’ in workspace.json. In my project, it can be found here (note the breadcrumb), and these are the default settings.

If I run the command
nx run client:build:production |
I see this in the output:

There are ways to integrate bundle size budget warnings and errors into your CI process, e.g. see bundlesize, but this blog post won’t cover that.
Suppose your initial bundle size is too big. How do you analyze it?
Webpack Bundle Analyzer
Webpack Bundle Analyzer (WBA) is a tool to help you visualize your bundle sizes. It creates an interactive zoomable “treemap”. The top level rectangles are chunks and the child rectangles are dependencies. The size of each rectangle is proportional to its bundle size. Therefore, WBA can help you rapidly zero in on the biggest dependencies first, where fixing things might have the biggest impact.
There are a number of other articles that can introduce you to WBA. I hope this one goes a little farther and offers a few more tips, especially with respect to how WBA can work with an Nx React app.
Set up WBA with Nx
First, install WBA and npm-run-all as dev dependencies:
npm i -D webpack-bundle-analyzer npm-run-all |
Add these scripts to your package.json (in the scripts section)
   "client:build:prod": "nx build client --prod -- --memoryLimit=8192",
    "client:build:prod:stats": "nx build client --prod --skip-nx-cache -- --memoryLimit=8192  --statsJson",
    "client:build:dev:stats": "nx build client --skip-nx-cache -- --memoryLimit=8192  --statsJson",
    "analyze:prod:stats": "run-s \"client:build:prod:stats\" \"webpack-bundle-analyzer\"",
    "analyze:dev:stats": "run-s \"client:build:dev:stats\" \"webpack-bundle-analyzer\"",
    "webpack-bundle-analyzer": "webpack-bundle-analyzer dist/apps/client/stats.json",
|
You will notice there are dev and prod versions of the commands. What I discovered is that both versions are potentially useful. The Prod version is more “real” in that it is more accurate with respect to the bundle your actual users will get. On the other hand, the Dev version can have some more information and can be easier to analyze, as we will see later.
npm-run-all is a convenient cross platform tool to help you run your scripts in parallel or in series. –skip-nx-cache makes sure we recalculate the cache and I found this was necessary when switching back and forth between dev and prod versions of the stats for WBA. –memoryLimit=8192 speeds up the build on my computer by 10-15s. –statsJson generates the stats.json file that WBA will require.
The Prod Version
The command to just generate a prod version of the stats.json file:
npm run client:build:prod:stats |
Here’s a snippet of the generated stats.json from prod version:
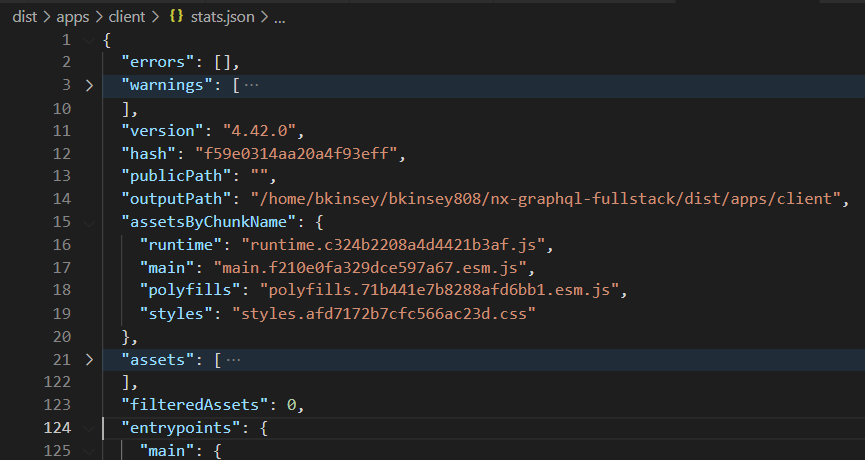
Run the full command to see this visually:
npm run analyze:prod:stats |
In your terminal, you will see

In VSCode terminal, you can ctrl+click on the URL to jump to the WBA page, which looks like this for me:
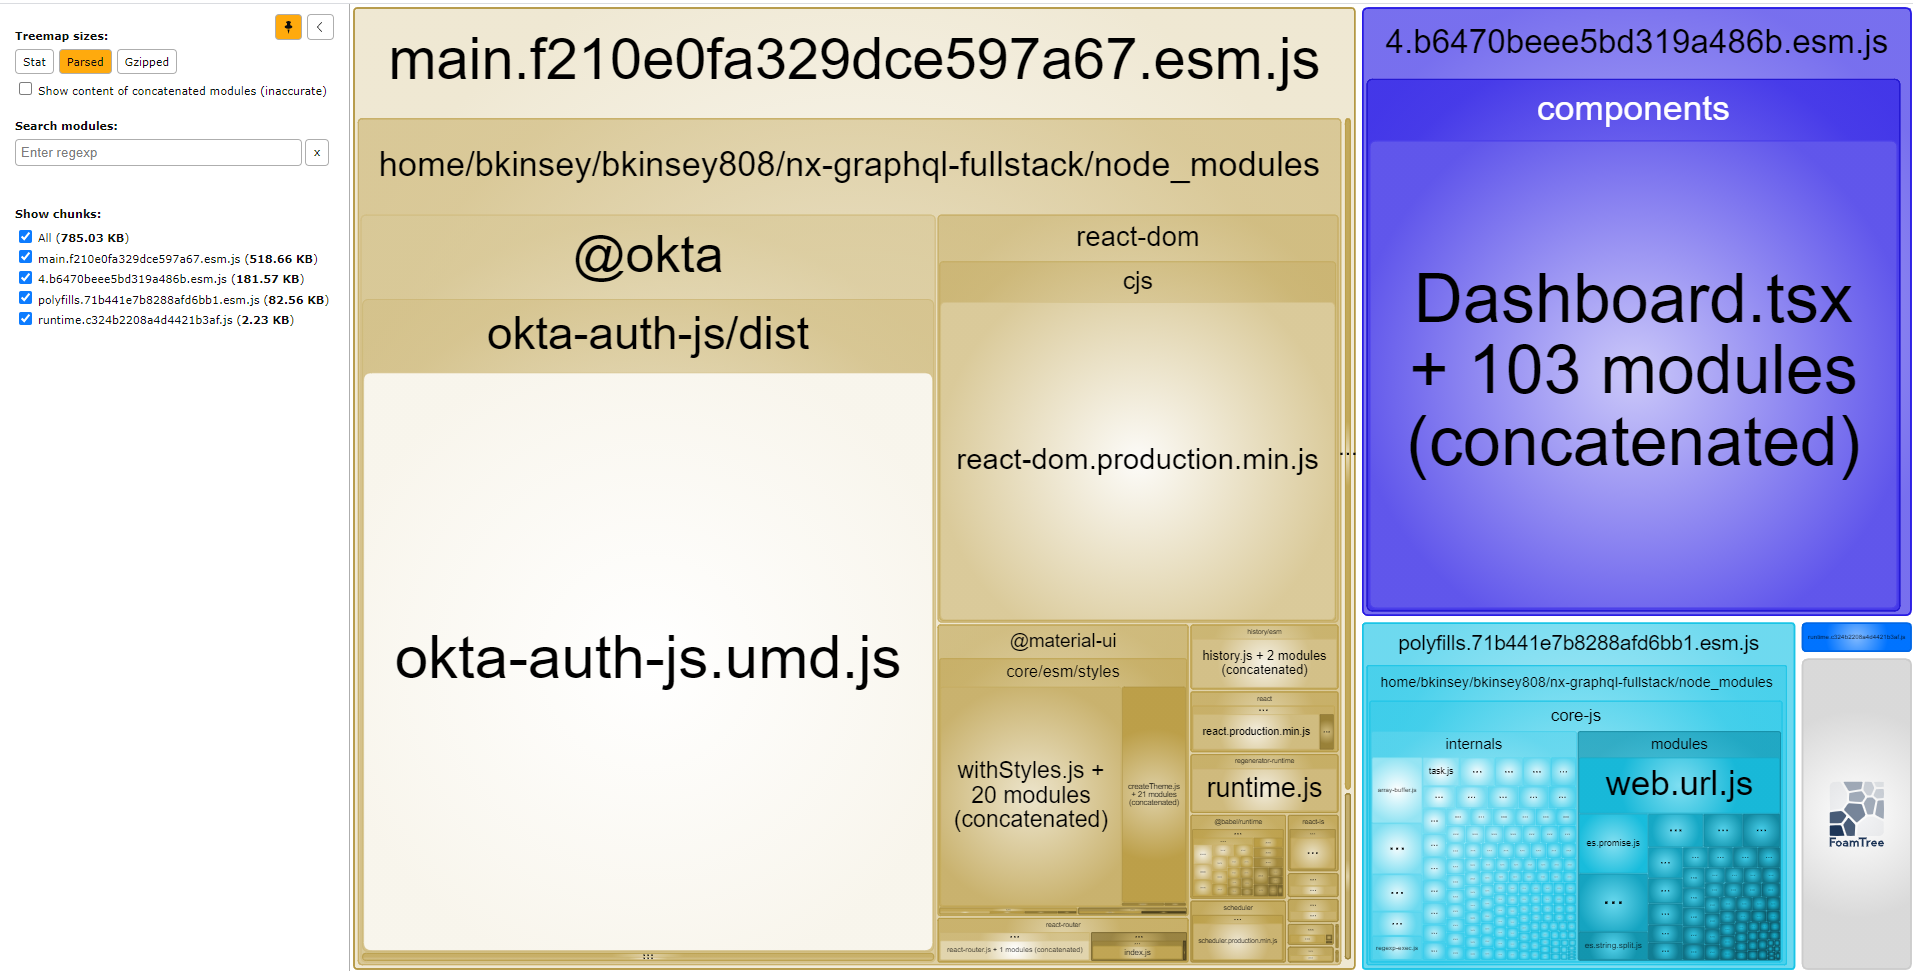
On the left, you can see the bundle size of “All” is 785KB. The bundle size of just the lazy loaded components, shaded blue, which starts with 4.b6… is 182KB. Unfortunately, that components box is not broken down further. I’m not sure why. It probably has to do with the way Nx has configured the build.
Note the useful pin icon, which fixes the left panel.
This is the prod version of the analysis. It’s accurate, insofar as the production bundle size is concerned, but it has a big limitation. To illustrate, consider, in this case, that I know that I’m including a dependency called urql in the bundle. However, if I search for it, it does not appear:

It turns out that urql is buried inside the lazy loaded blue components rectangle in the upper left, but the prod version of WBA on Nx doesn’t expose it for some reason. We need the dev version.
The Dev Version
To both generate a stats.json file and fire up the WBA site for the dev version:
npm run analyze:dev:stats |
The dev version of the stats file looks a little different:
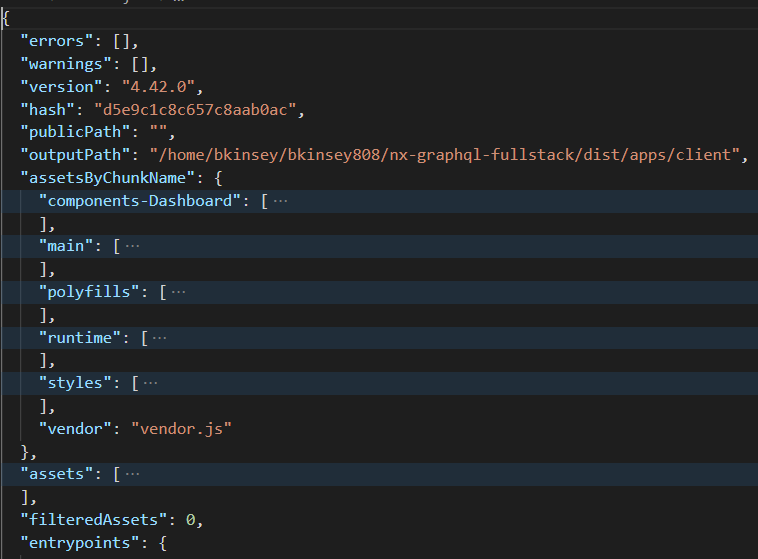
And visually:
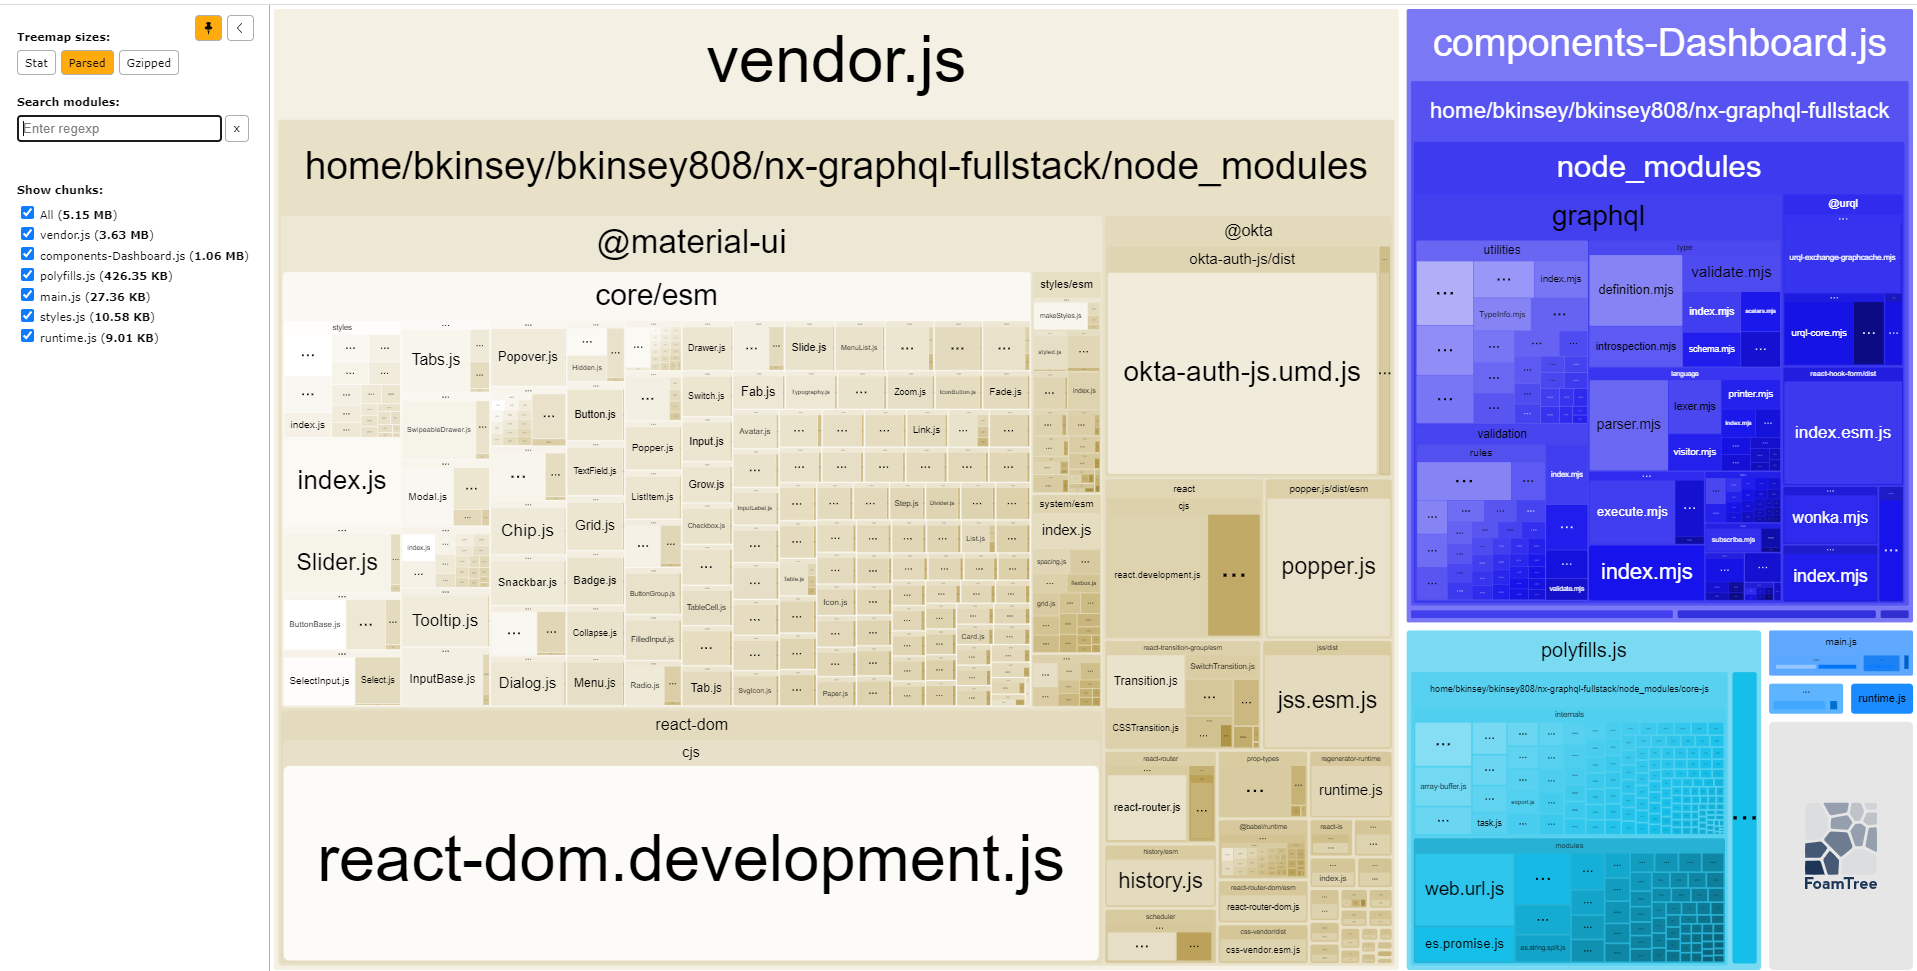
The big thing to note is that the size of All for the dev bundle is 5.15MB– significantly more than the prod version which was 785KB. The lazy loaded components bundle is also much bigger at 1.06MB vs 182KB.
However, now we can search WBA for and find the urql dependency:
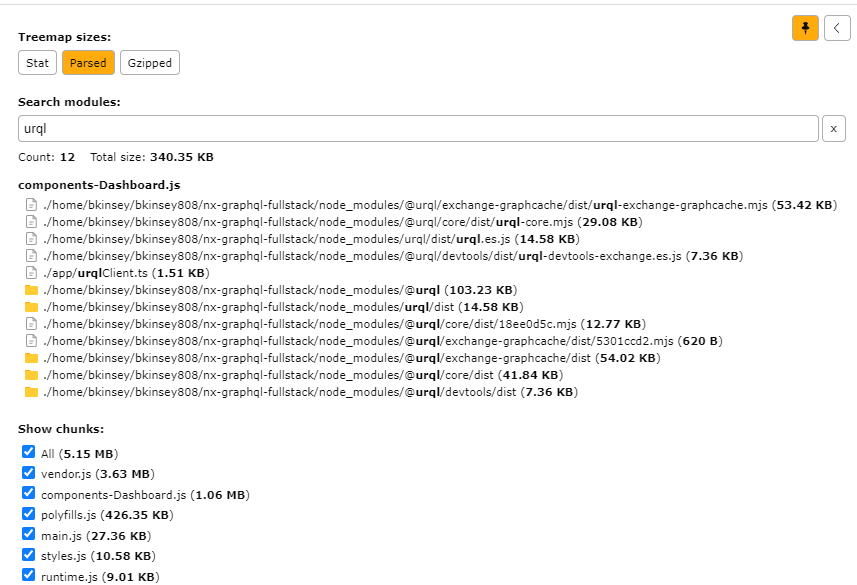
Clicking on the search results on the left to zoom in on the map to the right.
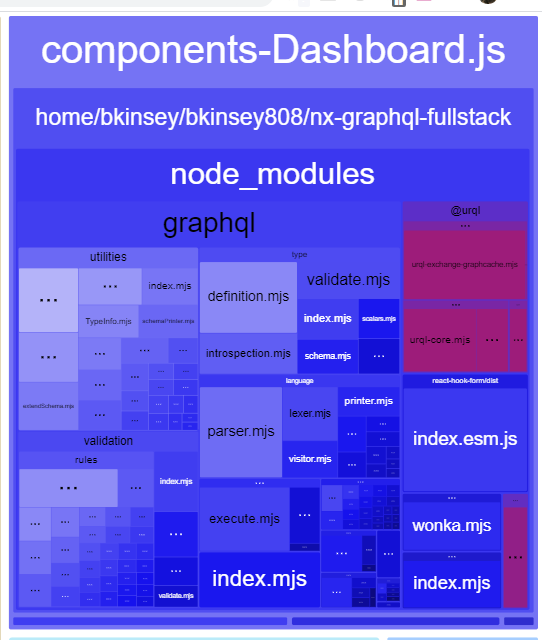
Escape key returns to the full view zoom level.
Chunk context menu
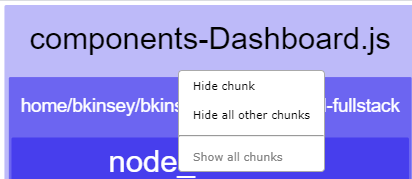
If you right-click on a chunk heading, there is a context menu:
Hide all other chunks is a neat option that allows you to look more closely at just a single chunk. In this case:
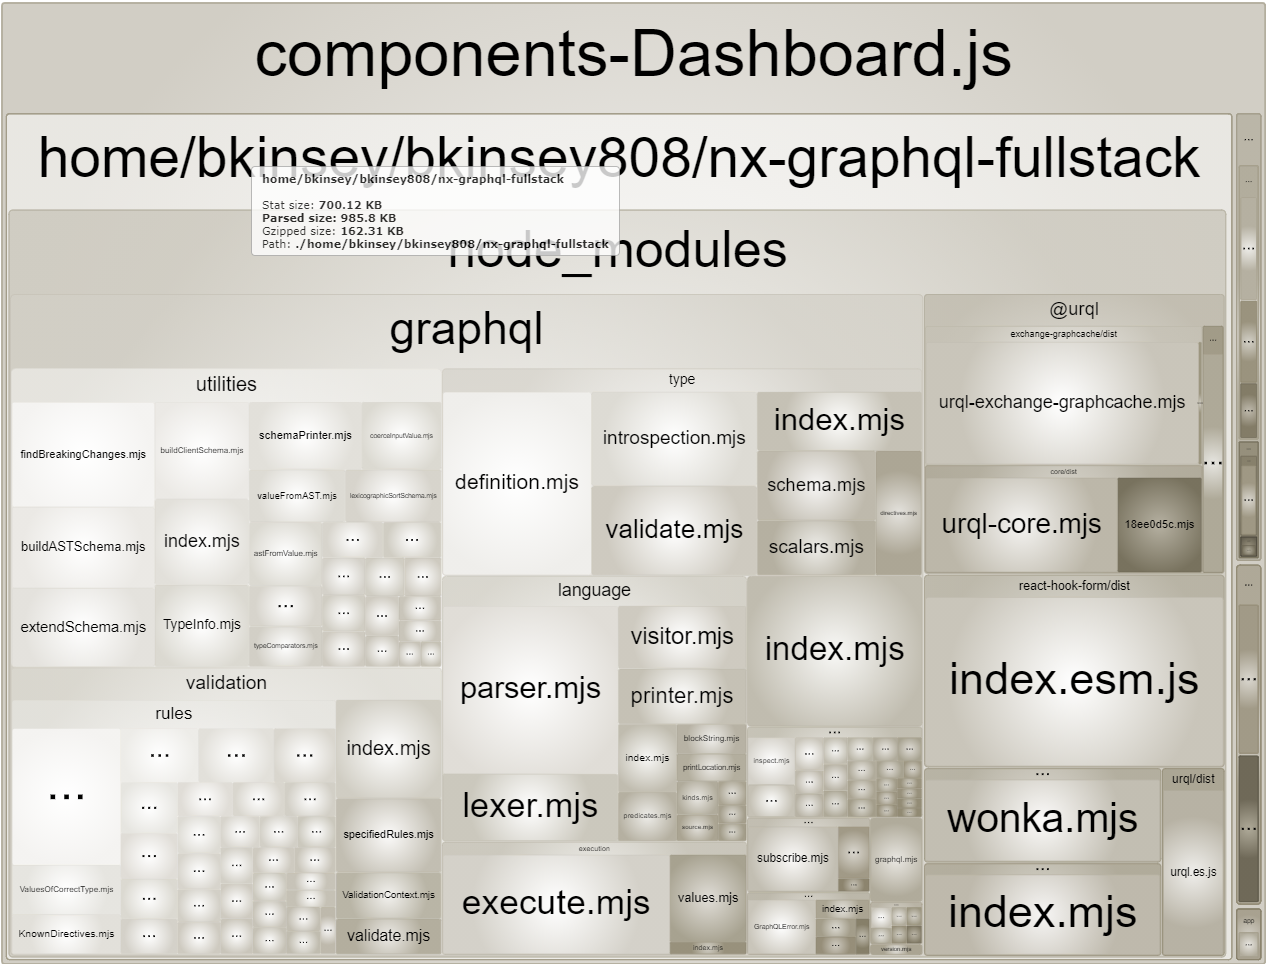
An invaluable resource: Bundlephobia.com
According to WBA, on the dev bundle, urql has a total size of 340KB parsed, and 75KB gzipped:

Contrast this with what bundlephobia.com tells us the size of urql is:
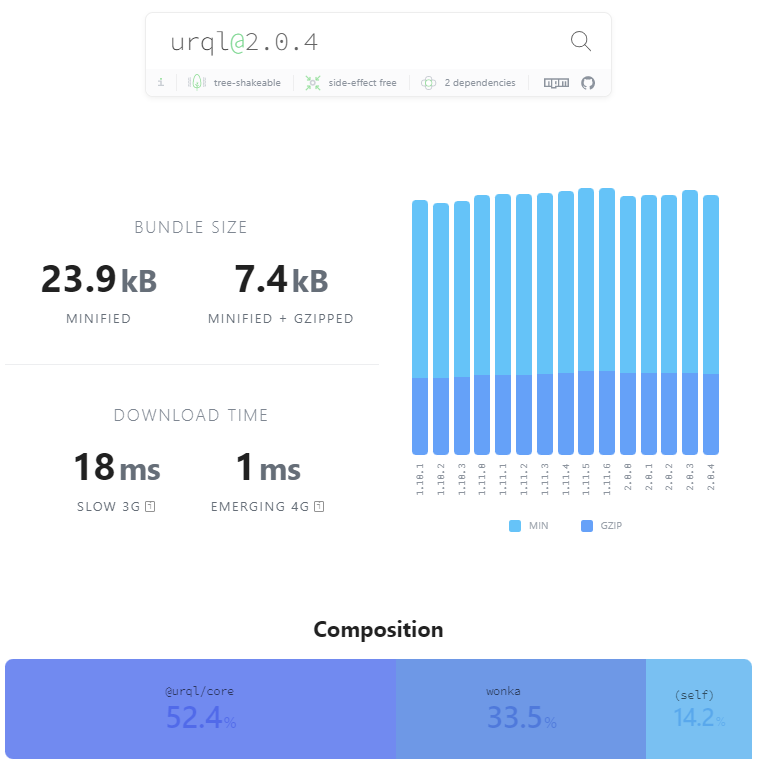
The discrepancy can probably be mostly attributed to dev vs prod. Also, the way we searched for urql in WBA included our own project code that consumes urql, but I think measuring consuming code is important too.
It’s often helpful to think in terms of relative size: units are sometimes hard to compare if derived from different sources. With WBA, you can prove to yourself that if you reduce the bundle size of dev, it should also usually reduce the bundle size of prod.
Watch your WBA Treemap
I recommend keeping an eye on your WBA treemap, especially before and after you add a dependency. Be especially wary of dependencies, such as Lodash, that don’t properly support es6 modules (and therefore tree shaking). In those cases, you may have to resort to cherry picking syntax to reduce bundle size.
Remember also that, byte-for-byte, Javascript is more expensive than equivalently sized images or other assets because Javascript has parsing, compiling, and execution costs.
With Webpack Bundle Analyzer you have a good tool at your disposal to experiment with:
- import techniques
- libraries with different bundle sizes and sets of tradeoffs
- lazy loading strategies
- dev and prod bundles

