Have you ever encountered long load times when populating data in Salesforce reports? Are you able to limit the number of records that load? Wonder what fields and objects are available in report types or even the median number of a column of data you are analyzing?
With Salesforce Reporting, you can make simple reports or create complex reports. The power is within the user behind the report.
What is a report? A report is a list of records that you specify to meet the criteria that you are creating. You can display this in rows and columns, filtered, grouped, and graphically. These reports can be stored in a folder that can be public, hidden, or shared. Reports also have security access, such as read-only or read/write. You, the creator, will control who has access based on roles, permissions, public groups, and license types. Reports can be added to a dashboard to further wow your team and to tell a story visually. Salesforce provides powerful, customizable, and intuitive reporting for all organizations.
Limit Results in Tabular Reports
Before, the feature found in Classic was cumbersome, and now Lightning could reduce the number of record rows with the Summer ’22 release. Using this feature, you can narrow down the most relevant records and reduce the processing time needed to generate the report. This change only applies to Group, Essentials, Professional, Enterprise, Performance, Unlimited, and Developer editions.
1. Create a tabular report on any object
2. Sort any column on your report
- You will find the Row Limit grayed out when you try to Add Row Limit filter if you do not sort a column first.
3. Click the drop-down arrow on the filter and click Add Row Limit.
4. Enter the number of rows that you want to limit the report to.


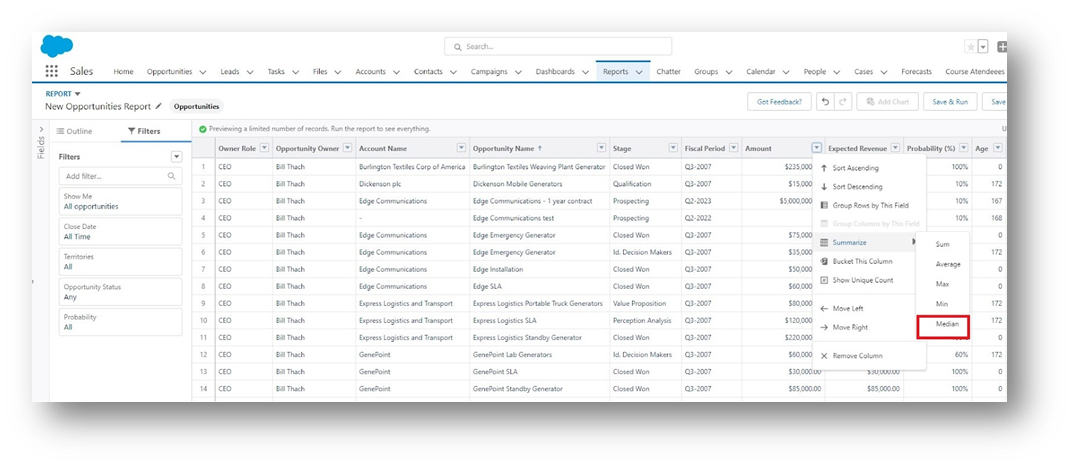
Summary Function: Median
An additional Summary Function for data columns with numerical values has been added. You can now summarize the Median of the data you are analyzing.

Enhanced Report Types
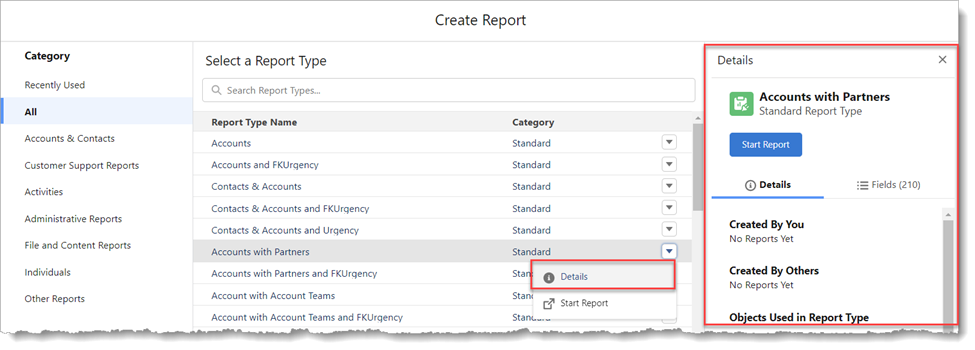
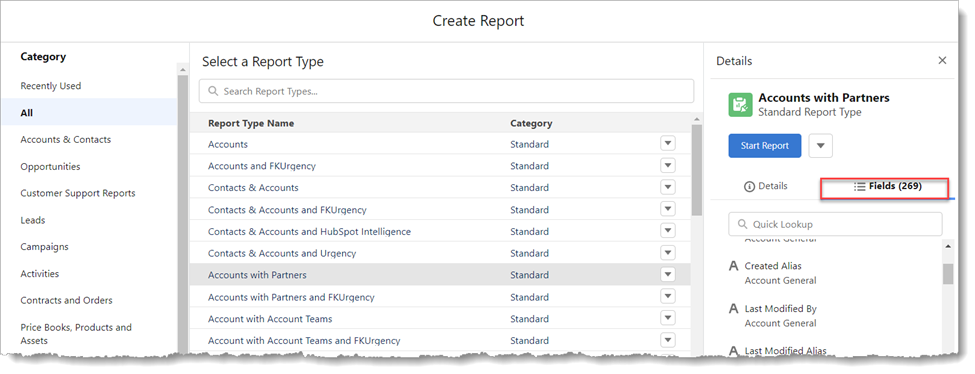
With the new and improved Enhanced Report Types, you can now see all the essential details before choosing a report type in Report Builder. There are no more guessing games that need to take place and wondering what fields are currently in the selected report and if there is a need to create another report type.
1. Click on the Reports tab.
2. Click New Report.

3. Click the drop-down arrow on any report type.
4. Click Details.
- You will be able to review the Details of the report.
- The Objects in the report.
- The Fields in the report.


Salesforce Report Types
Four standard report types are available in Salesforce: Tabular, Summary, Matrix, and Joined. Each one is best suited to show different data types, depending on what you want.
Tabular – This is the simplest of reports and is suited to showing lines of data and nothing else. It is like an Excel spreadsheet. If you want to show data without the need to show totals, calculations, or groups of data, then this is the report for you. It is also best to use this report type if you are planning to export data.
Summary – As soon as you add a grouping, you will turn the report into a summary report. Summary reports are the most used and are great for showing groups of data, e.g., if you want to see the number or value of opportunities per account, you should group your report by Account Name. You can also subgroup fields by dragging them under the initial group.
Matrix – Matrix reports are remarkably like the summary, but they allow you to group by rows and columns to see different totals.
Joined Reports – Joined reports allow you to create two separate reports to compare data. You could use a Joined report to show the total number of opportunities and cases per account, side by side.
You can read more in our Salesforce blogs.
XTIVIA can help you get to where you want to be! Reach out to us if you need help making your business more productive.

