Are your salespeople still giving you spreadsheets for their forecasts? Are they spending hours a week compiling the information you need? Then stop using Salesforce as a rolodex and start using it was designed, as a forecast tool.
Looking for the right data from Salesforce is very easy to accomplish simply by creating a report. Reports give you access to your Salesforce data. You can examine your Salesforce data in almost infinite combinations, display it in easy-to-understand formats and share the resulting insights with others.
In Salesforce you can build a report, filter the data you need and export the report. Reports in Salesforce are well-designed reports that run fast. The Report Builder is a visual, drag-and-drop tool which you use to create reports and edit existing ones. The report builder is where you select a report type, report format, and the fields that make up your report.
Fields help describe each reported result. If you imagine that your report as a table of information, then each row is a result and each column is a field. For example, a human resources manager creates a report about employees. Each result is an employee, and each field is a different piece of information about the employee: first name, last name, job title, start date, and so forth.
So when you create or edit a report, you choose which field you want to include in your report. To ensure your reports run quickly, it’s a good idea to include only the fields that you need.

Limit the data that your report returns by using filters. Filters are useful for many reasons, such as focusing your report on specific data, or ensuring that your report runs quickly. Add filters to the Report Builder. In Lightning Experience, you can add, edit, or remove filters while reading a report, too.

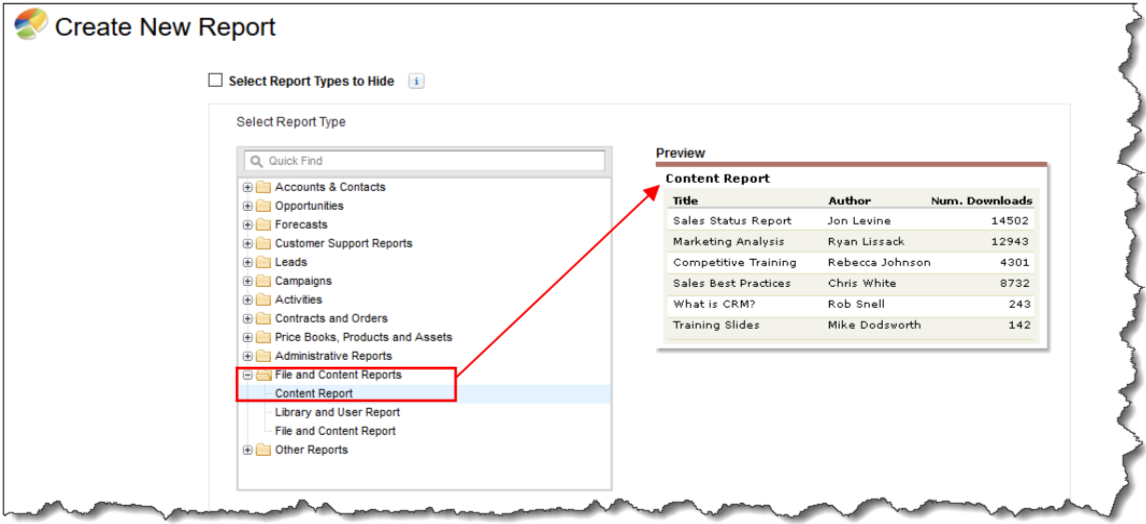
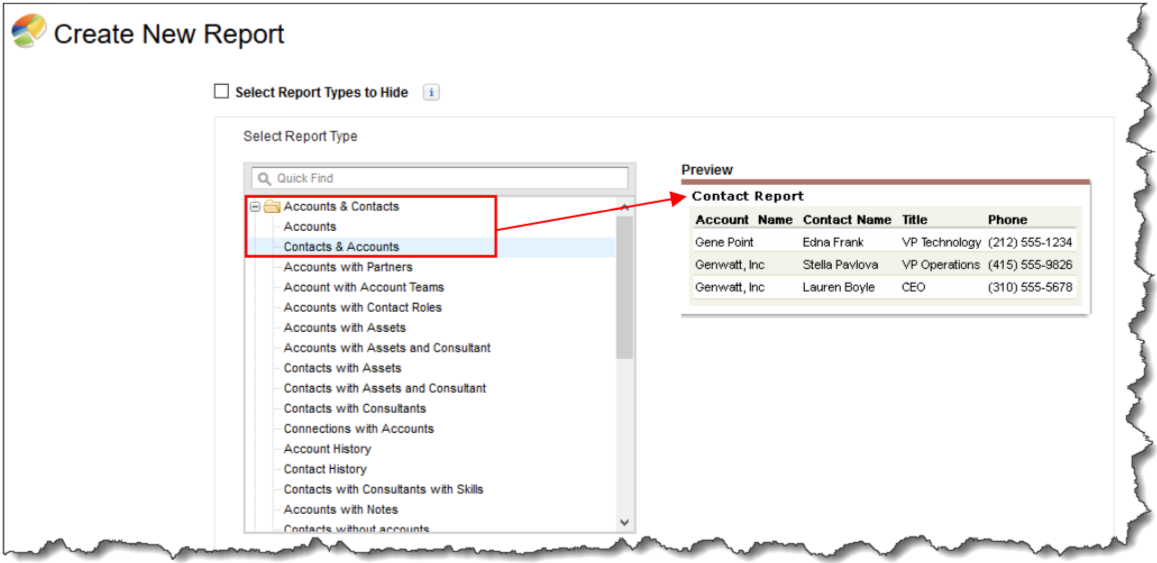
Account reports have fields like Account ID, Account Name, and Phone. The first thing you do when creating a report is choose a Report Type.

The Report Type governs which fields are available in your report. For example, File and Content reports have fields like File ID, File Name, and Total Downloads. For example, File and Content reports have fields like File ID, File Name, and Total Downloads.
The Report Builder consists of three panes, the Fields pane, which lists all the fields available for the report. The Filters pane, which lets you set standard and custom filters and the Preview pane, which lets you see your report as you build it. The Report Builder is a drag-and-drop tool for accessing your data quickly and comprehensively. Use it to set up new reports, edit existing one, and automatically schedule the report to run daily, weekly, or monthly. You may then have the report run automatically and sent to those who need it, so you don’t have to remember to do it yourself. Also, to work with report data in a dedicated tool, such as a spreadsheet, you may export report data as a Microsoft Excel® (.xls) or comma-separated values (.csv) file.
To learn more about Salesforce reports, see our Creating a Report in Salesforce video on our XTIVIA Technical Resource YouTube Channel on how you too can use this valuable tool.

